The Current Stack: From Handheld SLAM to Splat
A walk-through of the tools a single capture passes through — handheld SLAM LiDAR in the field, 3DFin on the desk, and two very different outputs at the end.
People ask us what the pipeline actually is. Not the philosophy of it — the tools. What do you carry into the forest, what runs on the data when you get home, and what comes out the other end. This dispatch is the plain answer, in order, with each stage shown.
The short version: we walk a block with a handheld SLAM unit, register and clean the point cloud, run 3DFin to pull per-stem inventory, and publish two representations — a point cloud for the record and a Gaussian splat for the room. Here is each step.
The Scanner
The field instrument is a handheld SLAM LiDAR — a multi-channel rotating laser, an inertial measurement unit, and a camera, all in a unit the operator carries on a short pole or body mount. SLAM stands for Simultaneous Localization and Mapping: the device estimates its own position and builds the map of its surroundings at the same time, correcting drift as it closes loops in the walked path.
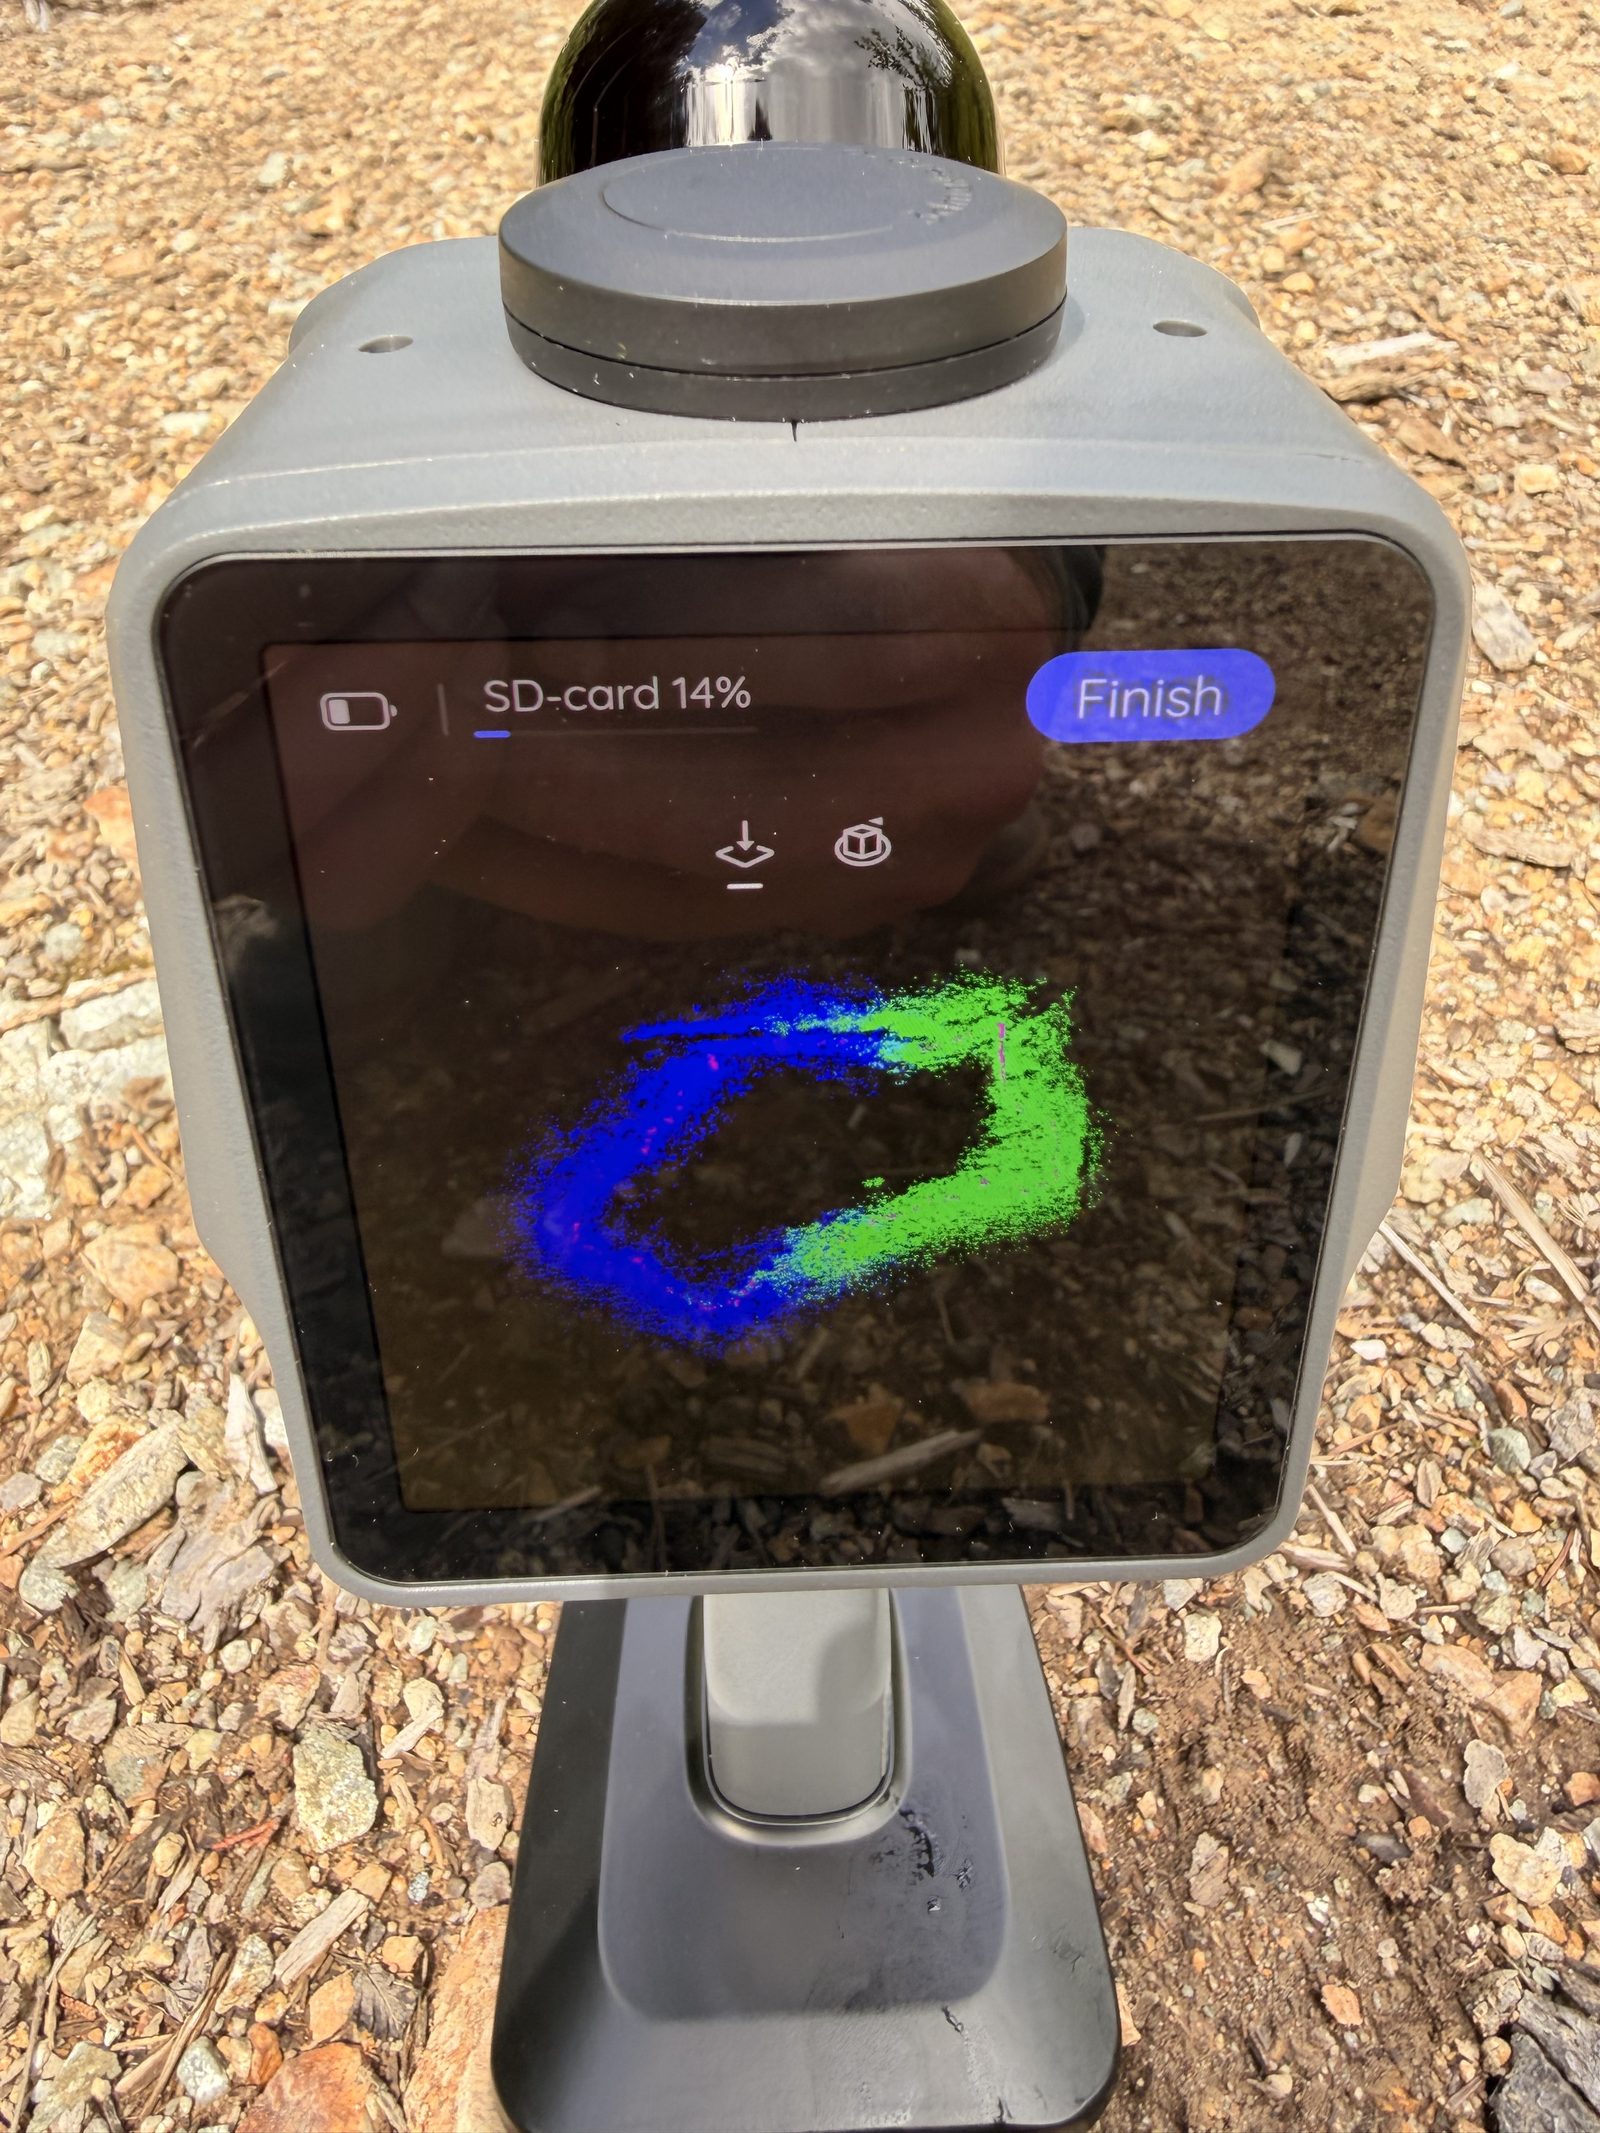
There is no tripod, no station setup, no scan dwell. You switch it on, walk a deliberate route through the stand, and the forest accumulates as a point cloud in real time. A two-person team can cover a 400-acre block in 10–14 field days, including GPS control and calibration — terrain that would take six to eight weeks of tripod stations.
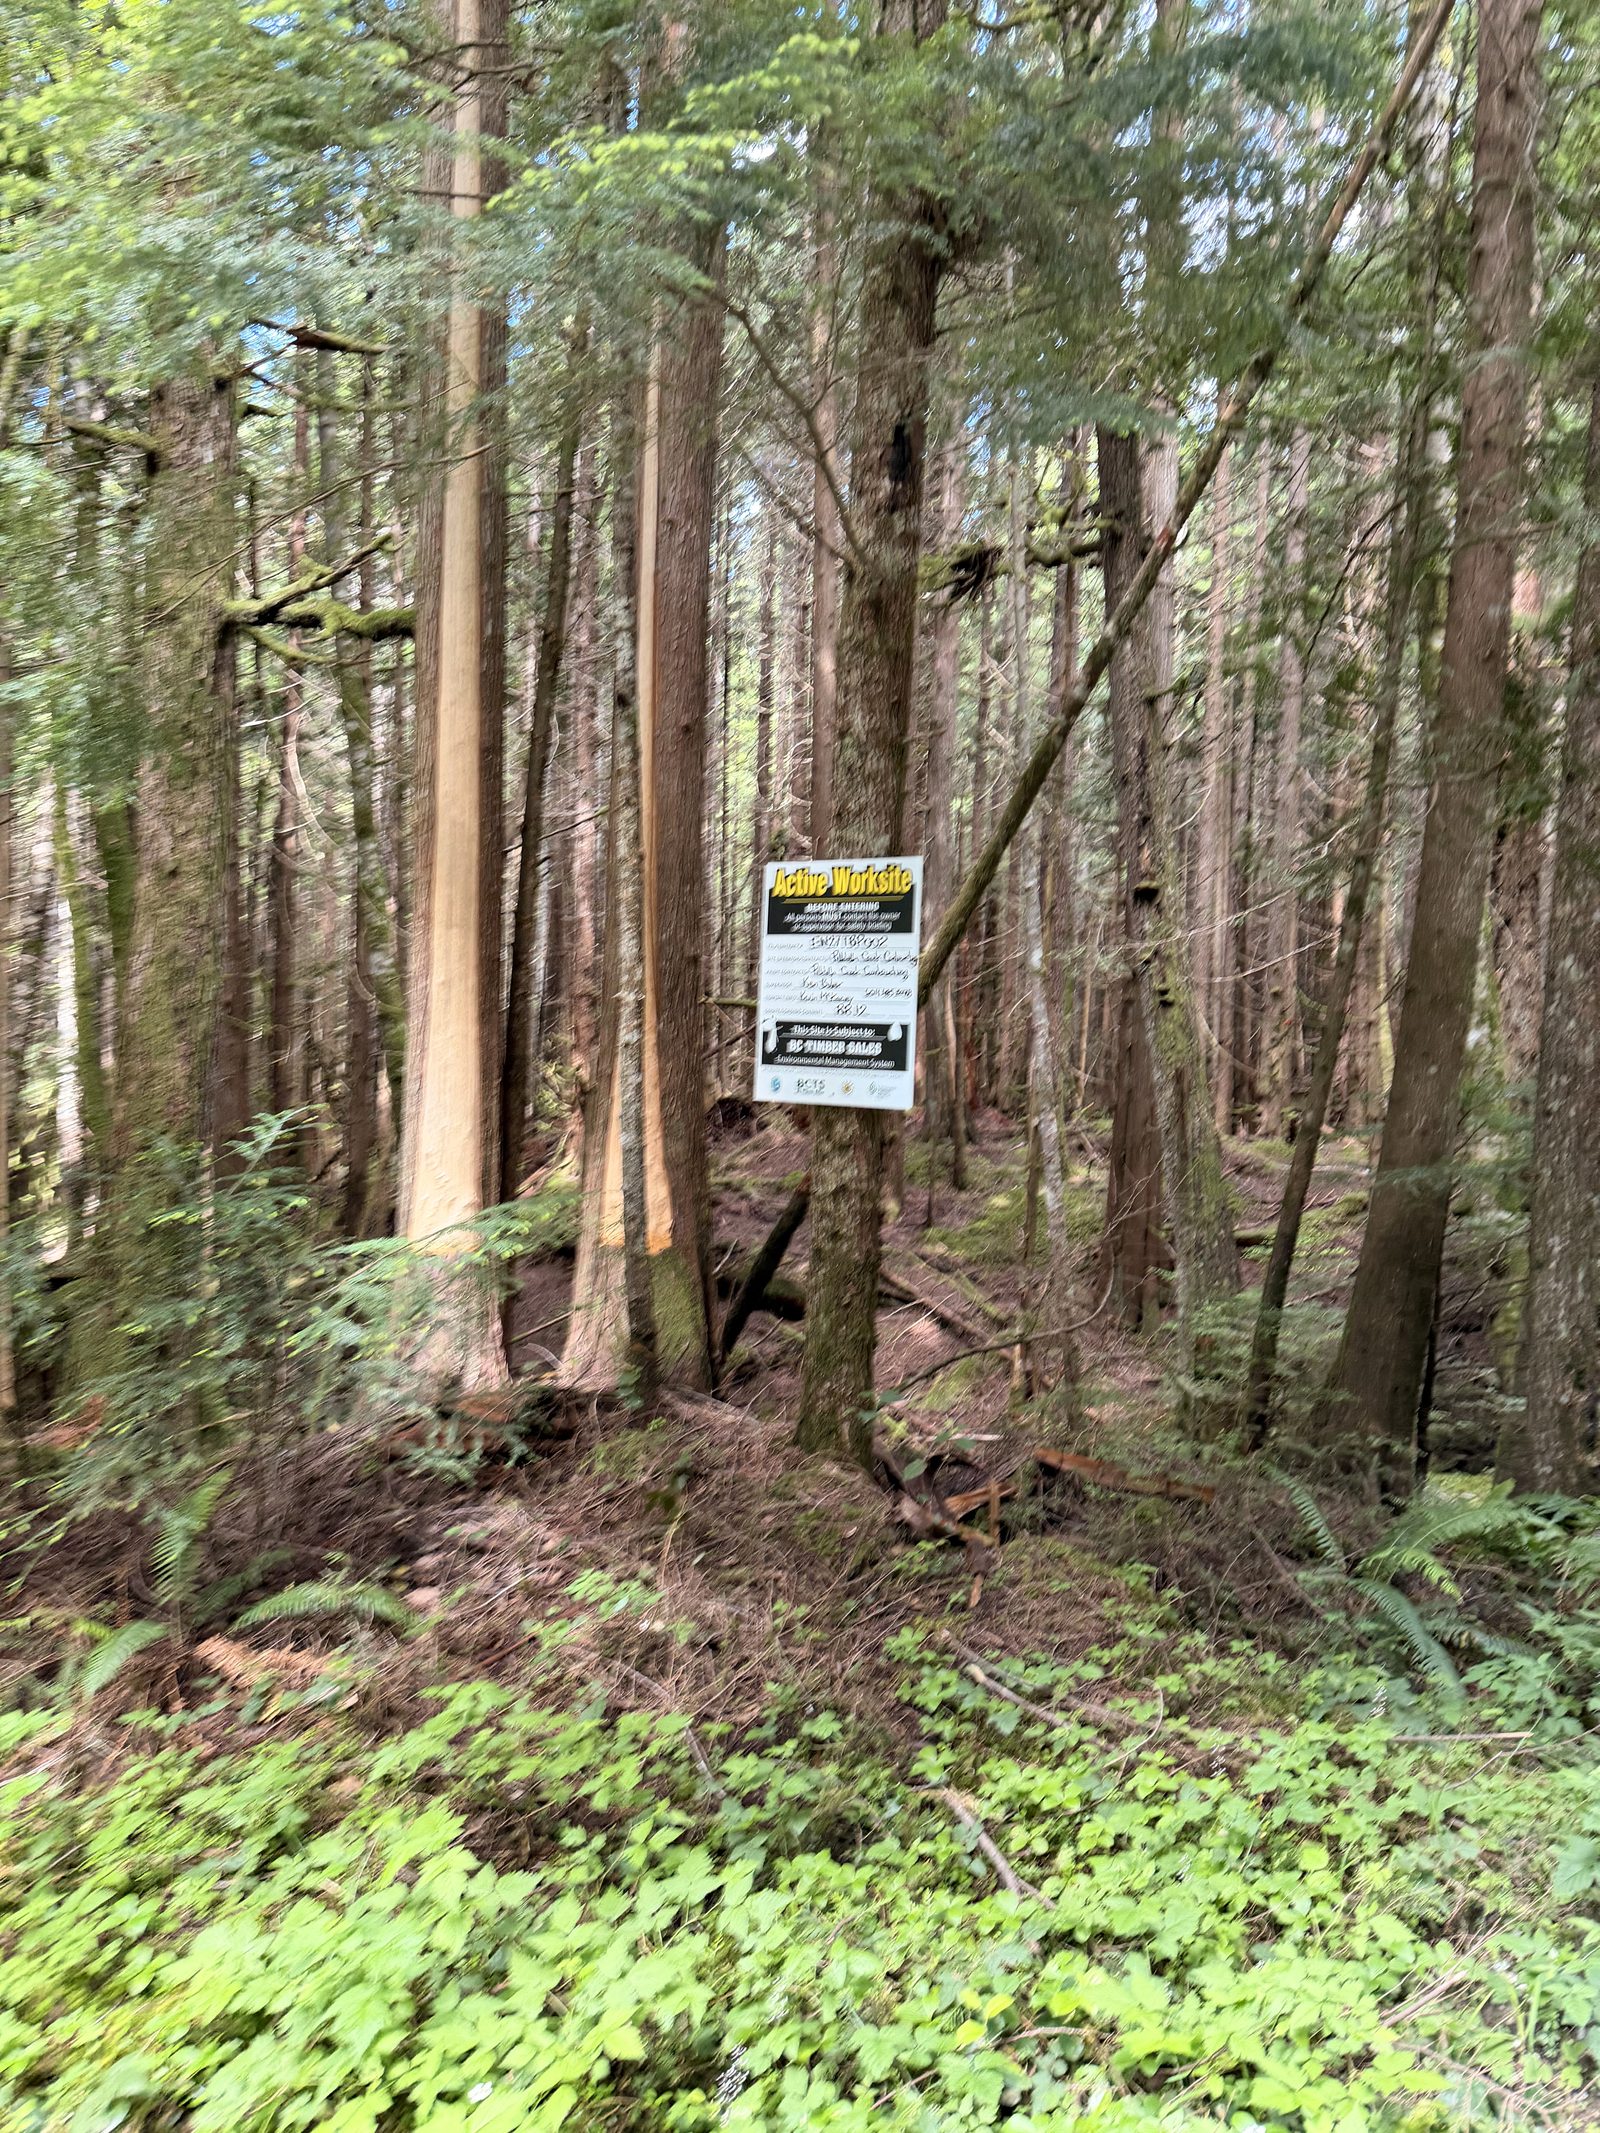
What comes off the device at the end of a day is a registered point cloud of everything the operator walked past: trunks, understory, deadfall, ground, and the lower canopy where sight lines allowed. It is dense, it is messy, and it is not yet inventory. That is the next stage.
3DFin Processing
3DFin (3D Forest Inventory) is an open-source tool for extracting tree-level measurements from a terrestrial or mobile point cloud. We feed it the cleaned, ground-normalized cloud for a block, and it does the work of turning a wall of points into a list of trees.
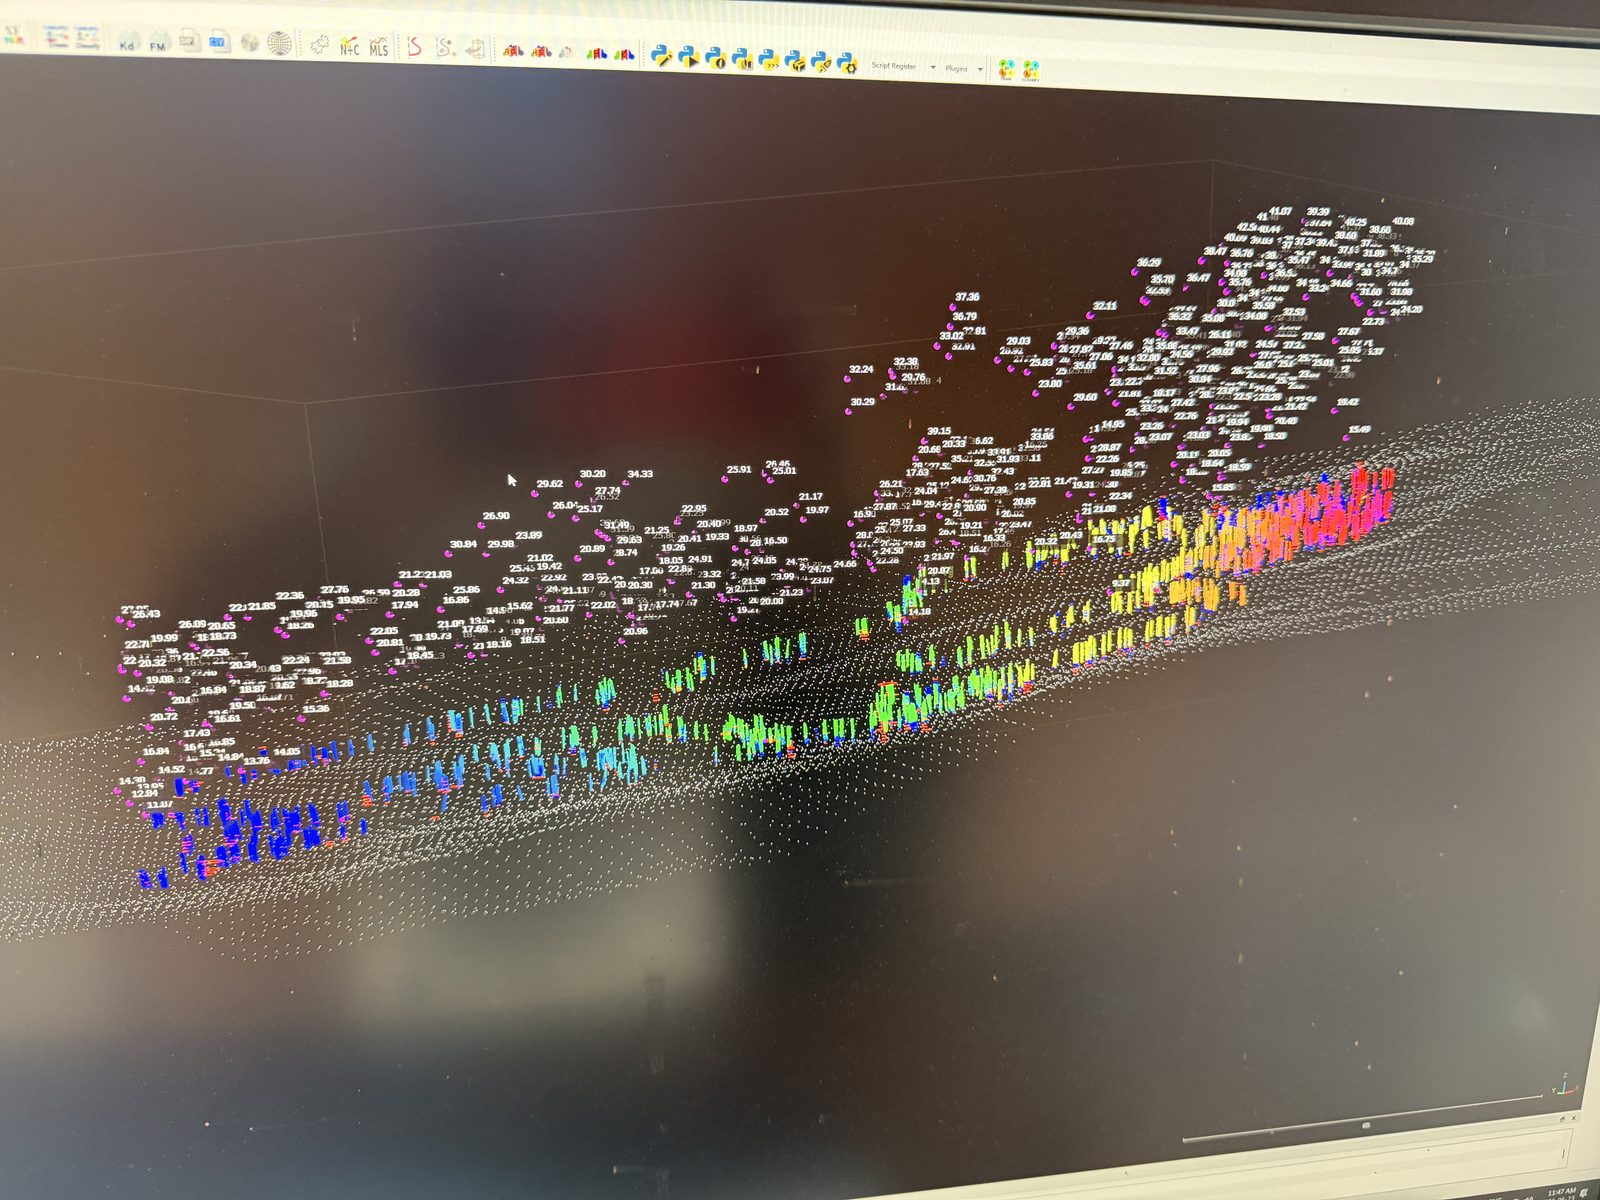
The processing runs in stages: it computes a height-above-ground normalization, identifies the stems standing in the cloud, fits a model to each trunk, and measures diameter at breast height (DBH) by fitting a circle or cylinder to the points at 1.3 m. The outputs are the things a forester actually wants — stem count, per-tree DBH, height, and stem location.
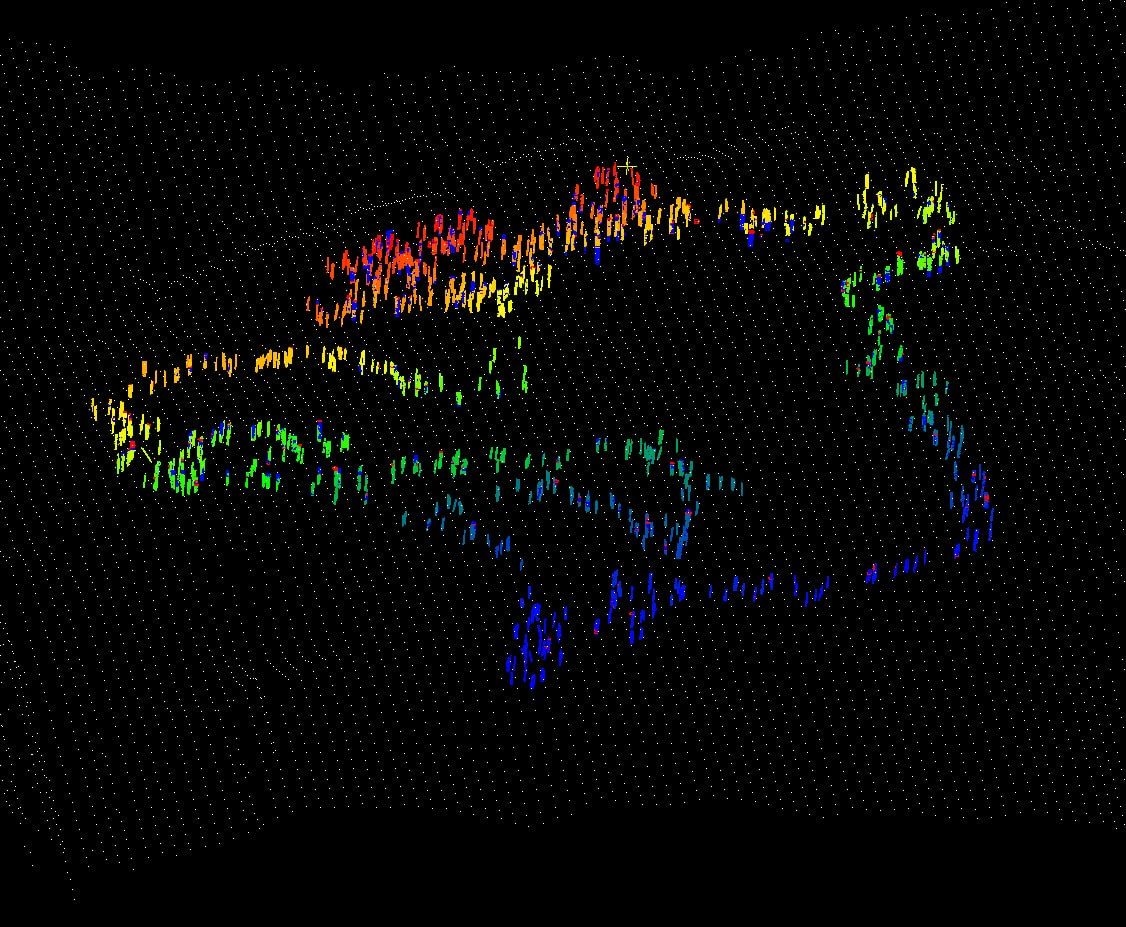
We validate the DBH fits against tape measurements on a sample of stems in every block. Mobile SLAM data lands around ±4% DBH RMSE — slightly looser than tripod data, immaterial for stand-level statistics like basal area and old-growth indicator density. When 3DFin reports that a block contains a given number of large-diameter stems, that number is traceable back to operations on the measured cloud.
Where the Outputs Go: The Atlas
The processed result of a block — the stem inventory, the statistics, and the published viewers — becomes an entry in the site Atlas. The Atlas is the public-facing home for each capture: a map-located record where anyone can find the block, read the numbers, and open the data.
Each Atlas entry links the two representations we publish for every capture. They are derived from the same measurements and they look superficially alike, but they are built for completely different rooms.
The Gaussian Splat
A Gaussian splat represents the forest as a field of oriented, coloured ellipsoids derived from the photographic source data. The render is continuous — no visible point structure, no gaps. Bark looks like bark. A person who has never seen a LiDAR scan can walk through a splat in a browser and understand, immediately, that they are standing inside an old-growth stand.
That is its job. The splat is the advocacy output: the .spz file that goes into hearing rooms, public briefings, and website embeds. It earns the emotional response. What it cannot do is be measured — you cannot query a tree or pull a DBH from a rendered Gaussian. It is communication, not computation.
The Point Cloud
The point cloud is the other half. It is the collection of discrete XYZ measurements — each with intensity and, where we fuse camera colour, RGB — that everything upstream was computed from. 3DFin ran on it. The stem counts came from it. It is the evidence.
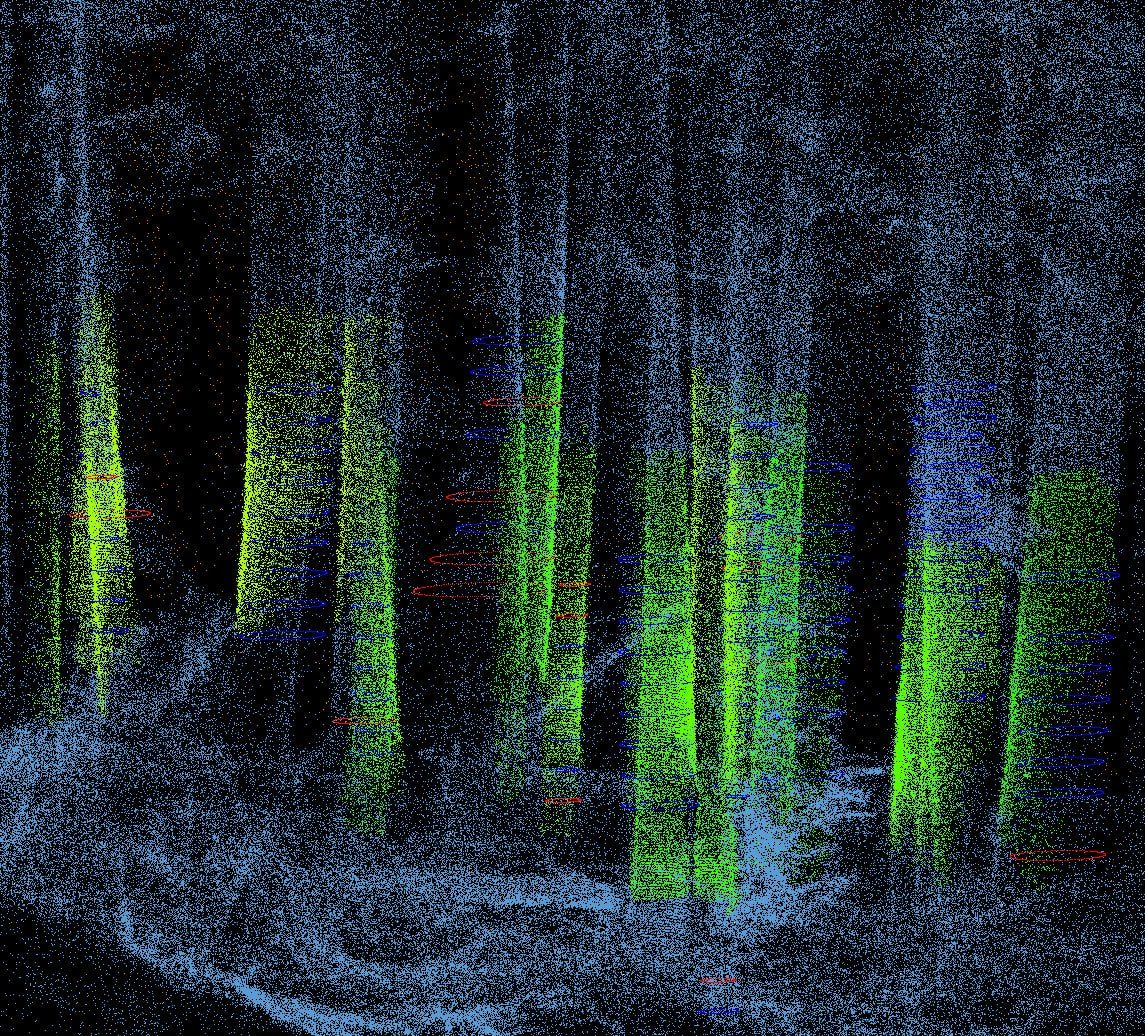
We archive it as .laz (compressed LAS), a geospatial standard that opens in every major GIS and scientific environment and will still open decades from now. It can be cited in a paper, attached to a legal filing, or handed to a university group as primary data. For the browser we serve it through Potree, which streams billion-point clouds via an octree so you can inspect the measured ground, the returns, and any artefacts directly.
That is the whole stack, end to end: walk the block with handheld SLAM, register and clean the cloud, run 3DFin for inventory, publish to the Atlas, and serve both a splat and a point cloud. The splat earns the response in the room. The point cloud earns the credibility. The forest is the same one — the only question is who needs to understand it, and what that understanding has to do next.
(The Atlas-viewer and Gaussian-splat figures above are placeholders and will be replaced with screen captures.)